Sentiment trading: Indicators & Definition
The sentiment is one of the main market drivers at the age of the global economy. While you are reading this article, sentiment is constantly changing and affecting the market right now. Once people started using the internet and web technologies, a whole new trading approach appeared.
Table of contents
The importance of the approach
Price on the asset is mostly decided by the forex market except for cases of blatant market manipulation that appear on small trading pairs and markets here and there. The market always follows some kind of sentiment. It is usually being formed by the fundamental news. For forex pairs, for example, news about the country’s macroeconomic performance might call for some kind of sentiment in traders that will set trends on the moving pair of the country’s currency.
But the main reason why you should try to determine and follow the market trend is the ability of the sentiment to change the security price from the Intrinsic Value. That concept highlights the sole purpose of trading and investing. While an asset may cost $1 intrinsically, the market price might reach $10 only because of the strong positive sentiment under it. One of the best examples is cryptocurrencies that mostly don’t have an intrinsic value but still cost hundreds or thousands of dollars.
The same concept works the other way: even if you see and buy a good product that has a high intrinsic value but falls under the negative market sentiment, you won’t be able to sell it for a good price.
That’s why you should always follow the market sentiment. This guide explains what to use for determining, following, and predicting market sentiment.
Social media
Today, social media platforms have a huge impact on the market, separate trading pairs, and even on the general sentiment. World’s biggest companies like Apple, Facebook, or Tesla are constantly using social media as information outlets, and traders from all over the world have no other choice but to follow their news and immediately react to the information that they provide them with.
In addition to big companies, you will have to evaluate the average sentiment between traders and small investors on separate stocks. Volatile stocks like TSLA or AAPL usually reflect the market sentiment in the best way since they have the largest trading volumes with so many people holding or trading them.
One of the best ways of following market sentiment is Twitter that provides you access to hashtags that are constantly being used to rapidly transfer different information. Using other media outlets like Facebook might not be that effective due to the slower speed of information transferring.
If you choose sentiment trading as the way of trading, you have no other choice but to follow social media most of your time. Before making any trade, you can evaluate the market sentiment by browsing through hashtags on Twitter and reading posts that big influencers make, especially the ones related to asset safety.
Market sentiment
Evaluation of the forex sentiment is done not only by looking at the social media sentiment but also by using a fundamental analysis which includes reading the company’s performance report, recent news, macroeconomic reports of the country, etc. By analyzing documents and sources that directly create a sentiment, you will be able to evaluate the current market situation.
There is some type of traders that evaluate the market sentiment by directly looking at the chart of the index or single security. By using technical analysis, they can determine whether the trend is currently positive or negative. Generally, there are two types of sentiment: bullish or bearish.
Bullish Sentiment
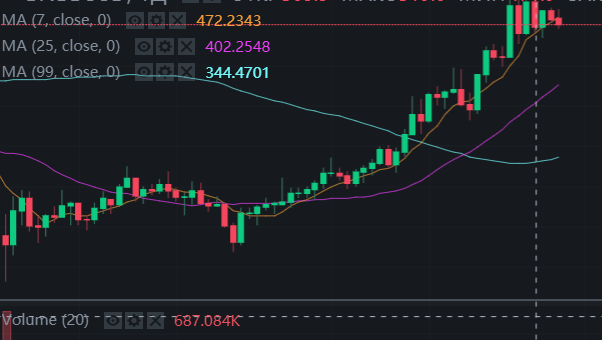
The market is considered bullish when the overall sentiment of its participants is positive. Let’s say, big tech companies are currently in the bull trend. What does it mean? It’s the same as saying “Big tech companies are currently growing”. If the market is called bullish, it’s growing under the positive sentiment.
Bearish Sentiment
Pretty sure you’ve already got it. If bullish means “growing”, bearish means “falling”. When the market is considered bearish, you should expect most of its participants to open short (or sell) positions and leave the market until it becomes bullish again. Sentiment in that kind of market is considered negative and it’s not recommended to enter deals.
What indicators to use in sentiment trading strategy?
Even though indicators are commonly being used in technical analysis, sentiment traders also have a couple of tricks up their sleeves. But they highly differ and are usually calculated based on fundamental factors like opinions, market indicators, or macroeconomic values.
Sentiment trading indicators are not working based on previous price movements or any historical data related to the security. Those indicators are usually aimed at collecting data from various sources to show you the overall sentiment based on people’s opinions or technical data like options interest rates.
CBOE Volatility Index (VIX)
Volatility is a strong tool for evaluating market sentiment. To use volatility as a trading tool you need to take a look at tools like CBOE Volatility Index which is commonly being referred to as VIX.
VIX is a real-time index that mostly represents the short-term price fluctuations of the S&P 500 index. An index creates a projection of 30-day volatility of the S&P values. The indicator allows you to measure the risks and fears of the market participants. High values of the index warn us about the market sentiment being unstable. In such cases, the right decision would be to refrain from investing.
Fear and Greed index
Another tool for measuring general market sentiment is a Fear and Greed Index that’s commonly being used as a determination tool of the overbought and oversold periods that sometimes appear on volatile markets. The index can help us predict long or short squeezes on the market or give us a hint on where the local top or bottom of the trend is.
Fear and Greed indexes are calculated differently for various markets. For example, there are two completely different fear and greed indexes for cryptocurrency and stock markets. If you are trading stocks or forex markets make sure to track the right index on websites like CNN.
Buffet indicator
To determine a valuation of the company you need to calculate the GDP-to-capitalization value or simply use the Buffet Indicator. To determine if the market is undervalued or overvalued the legendary investor Warren Buffet had used the Stock Market Capitalization-to-GDP Ratio indicator and then popularized it as one of the best market valuation tools.
If the indicator shows values of 50 to 70 percent, the market can be considered undervalued. Range of 90 to 115 percent makes the market overvalued. To make money on the stock market, you’ll have to avoid investing in the overvalued market due to the risks of a major correction or retrace.
Opinion polls
Opinion polls are one of the ways to evaluate the current sentiment based on the opinions of the most influential market participants. Note that the general opinion of 1,000 average investors and traders won’t have any impact on the sentiment due to their low volume (read: influence) on the market. On the opposite, the opinions of 10 CEOs of big companies are most likely to directly impact the market sentiment since most of the market participants will follow their opinions.
Some of the opinion polls are provided by companies like Sentiment reports, Market Vane Bullish Consensus, and Consensus Bullish Sentiment Index. All these polls are not just statistical data but actual professionals reports. Those reports include opinions and thoughts of the American Association of Individual Investors so you should keep in mind that it mostly reflects the sentiment of personalities, not crowds.
Quantitative indicators
Aside from the opinions of other market participants, other indicators can help us understand the overall sentiment on the market. Quantitative indicators show you the statistical data on the chosen subject. It might sound complicated at the beginning, so let’s look closer at one of those indicators to get a clearer view of the subject.
Put/Call ratio
Put/Call ratio or percentage shows you the amount of opened put and calls option on different prices. First of all, let’s refresh our memories and find out what options are.
Options are market products that allow you to receive the right of buying an asset for the specified price. The main benefit of an options contract is that you receive a right to buy or sell the asset but not the obligation to do so. Mainly options are being used to hedge opened spot positions in case of high market volatility. Put options give you the right to sell an asset and call options to give you the right to buy assets.
To understand options better, let’s look at the example. A trader decides to buy XYZ stock for $10 but he is afraid that something might happen on the market and the price will drop to $5. His loss will be $5 in that case. To avoid losing money, our trader decides to open an option contract with a call price of $5. He pays $1 for that contract and XYZ stock actually drops to $5. But since our trader hedged his position on the market, he didn’t lose $5 he actually lost only $1 dollar because he was able to buy XYZ stock for $5 basically when it cost $10 at the time of contract signing.
How can sentiment traders benefit from the put/call ratio? It’s simple. If we see a large number of Call options on, let’s say, the $200 price of the XYZ stock, we discover the fact that someone is betting a large amount of money. It also means the XYZ stock will hit the $200 price in a labeled period of time. Moving from here, we can start understanding the overall market sentiment better.
Open interest
Volumes of open options positions are usually being called ‘open interest’. It’s another indicator for a sentiment trader that becomes a great addition to the put/call ratio. Even when we see some amount of open options at some price, we shouldn’t consider it an actual sentiment signal until we see the open interest.
Let’s say traders have signed options contracts worth $1 mln on XYZ $100 call. In that case, we can say that XYZ stock actually has some chances of hitting $100 in some period of time. But at the same time, we see some open interest on XYZ $120 call which is only backed by $100,000. In that case, we should assume that there are more chances for XYZ stock to hit $100 than $120 because traders are mostly betting on $100 calls rather than $120.
In terms of sentiment trading, we can create a simple equation based on the obtained knowledge: If there’s more open interest on a call position than on put ones, the market is bullish. Vise-versa: If there’s more open interest on put positions than on-call ones – the market is bearish.
Short-term trading index (TRIN)
TRIN index was developed in 1967 by Richard Arms. It’s also known as the Trading Index which shows us the inflow and outflow of the funds to the market. This indicator allows understanding how much assets flowed and left the market. By “market’ we mean securities. In order to understand the index, we will have to get familiar with the next terms:
- Advancing Stocks: Number of stocks that have closed in a profit (green candles).
- Declining Stocks: Number of stocks that have closed in a loss (red candles).
- Advancing volume: Total volume of profitable stocks.
- Declining volume: Total volume of declining stocks.
Whenever the TRIN index shows us a value above 1 we can consider the market bearish. If the amount of stocks that are closing in a red zone exceeds the number of stocks that are closing in a green zone, we will have the value of the indicator higher than 1. But whenever the indicator goes below 1, it shows us that the current market sentiment is bullish. If the ratio stays around 1 but does not go higher or lower, we can consider the sentiment neutral.
Conclusion
Sentiment trading might not be the most popular way of investing or exchanging assets. But it most certainly should be a part of a fundamental analysis that allows us to select perfect times to enter or exit markets. Sentiment trading as a separate strategy indeed has many drawbacks including time-consuming market analysis or a separate stock’s traders sentiment. Usually, sentiment analysis just becomes a part of complex trading strategies that are based on a fundamental analysis of various performance indicators.
By using the above-mentioned sentiment trading tools, you will be able to track the social media data, analyze the option’s open interest and evaluate current market sentiment by tracking the inflow and outflow of the funds. In addition to that, we’ve covered a small part of the options trading and its purpose on the financial market.
If you decide to become a sentiment trader, you should start researching additional data like macroeconomic analysis, news outlets, reports from financial regulators, and more. Without diving deep into the world of financial analysis, you won’t be able to properly execute the sentiment trading strategies.

