Pivot points represent the averages for the lows, the highs, and the closing prices that happen within a trading session or a trading day.
It is possible to acquire several points that might aid in determining the levels of support and resistance using some basic calculations and the tracking of conventional price indicators (max (low), min (high), opening (open), and closing (close) of the days before).
These are known as “pivot levels,” and they may prove to be your most valuable ally in anticipating market direction.
The ease of computation, along with the predictive aspect of pivot point analysis, is indeed one of the primary reasons pivot point analysis has become so popular: traders may utilize information from the days before to determine probable turning points for either the present day or the next day.
Pivot Points can be explained as price levels that are calculated using technical analysis and basic mathematical formulae and are important in determining the levels of support and resistance.
Contents
WHAT ARE PIVOT POINTS?
Traders on stock, currency, and commodities exchanges utilize pivot points. They’re computed using past trading sessions’ low, high, and closing prices, and they are used to forecast resistance and support levels for the present or next session. Traders may use these support and resistance levels to establish exit and entry points, as well as stop-loss and profit targets.
Pivot Points are excellent indicators for finding intraday resistance and support zones that are relevant for the next trading session.
When compared to technical analysis of leading indicators/oscillators, pivot points are characterized by their objectivity, since we rely on simple mathematical formulae for their identification.
Pivot Points’ utility is tied to day-to-day activities. Trend reversal points and key levels that validate or strengthen a breakout can be identified using pivot levels.
As a result, pivot points are critical, and they’re also employed in automated trading systems.
Pivot points have been existing since the beginning of trade, and even before computers were widely used.
PIVOT POINTS ARE SUPPORT AND RESISTANCE
As a result, Pivot Points are simply support and resistance levels, a terminology which even inexperienced traders are aware of.
The Pivot Points, on the other hand, are more sophisticated than commonly used supports and resistances, as a consequence of calculations that take into account a larger number of variables.
In actuality, the Pivot Points are just a hyper-simplified variant of the supports and resistances as understands by everyone. They consist solely of minimum and maximum values, which are generally updated regularly.
Is it acceptable to utilize maximums and minimums as resistances and supports, or Pivot Points?
Minor modifications on an operational level, in a way that the same procedures are utilized to use both.
It’s a rhetorical question. That, meanwhile, has something to do with accuracy and efficacy.
Pivot Points, on the other hand, are far more exact. This is because, as previously stated, they are the outcome of computations involving separate components.
The supports/resistances derived from the minimum are easier to recognize and, as a result, more useful. Sometimes all that is required is a quick glance.
As a result, it is dependent on how in-depth the trader wants to go with his investing activity and how he approaches technical analysis.
If his research efforts have focused on indicators that, for example, discovered the issue of signals involving the use of statistical volume analysis, then the supports/resistances derived from the minimums are adequate, since his method does not consider supports and resistances to be the main dish of the menu.
PIVOT POINTS CALCULATION
Most charting software packages that enable you to modify the indicator may compute pivot points for multiple timeframes. Some systems, for instance, may enable you to compute pivot points on either a weekly or monthly basis. The standard indication, on the other hand, is plotted on a daily basis.
The pivot point – the center price level – is determined as a function of the preceding day’s high, low, and close (or period, more generally). These numbers are added together and split by 3. This is the same thing as the term “normal pricing.”
Pivot Point = [High (previous) + Low (previous) + Close (previous)] / 3
The pivot point’s value is used in computing the other six price levels – three resistance levels and three support levels.
The three degrees of resistance are referred to as resistance 1, resistance 2, and resistance 3. And support 1, support 2, and support 3 are the three levels of support. They’re also known via their abbreviations: R1, R2, R3, and S1, S2, S3 respectively.

These values are calculated as follows:
- R1 = (Pivot Point x 2) – Low (previous period)
- S1 = (Pivot Point x 2) – High (previous period)
- R2 = (Pivot Point – S1) + R1
- S2 = Pivot Point – (R1 – S1)
- R3 = (Pivot Point – S2) + R2
- S3 = Pivot Point – (R2 – S2)
Because price levels are determined by the preceding day’s low, close, and high, the larger the difference between these values, the larger the gap between levels on the next day of trading. Similarly, the narrower the trading gap, the shorter the gap between levels the next day.
It’s worth noting that not every level will show up on a chart at the same time. This literally implies that perhaps the price chart’s scale prevents some levels from fitting within the viewing window.
INCLUDING PIVOT POINTS IN YOUR CHART.
There’ll be seven levels if you use the fundamental pivot point and the 3 support and resistance points. Manually doing the computations, as you can see, may be time-consuming. There are a few alternative ways to acquire the pivot points without having to conduct the math yourself.
CALCULATOR FOR PIVOT POINTS.
On the internet, there are several pivot point calculators. The 3 price action parameters must be entered into a pivot point calculator when it is first opened. These are the high, low, and close of the day. When you combine these 3, all you have to do is click a “calculate” button to acquire your pivot points. Once you’ve got it, all you have to do now is plot the pivot lines on your trading software chart.
HOW PIVOT POINTS WORKS
In summary, when cpr trading pivot points, there are a few fundamental principles to follow.
• Whenever the price is under the major pivot point, be bearish.
• Whenever the price is above the major pivot point, be positive.
• If the price bounces from S1, S2, or S3, go long.
• If the price rebounds from R1, R2, or R3, go short.
By now, it should be obvious that pivot points are often used as potential market turning moments. Taking trades in the line movement of the anticipated reversal at these levels is a typical technical approach.
Traders will link the pivot points method to additional indicators so as to increase the strategy’s effectiveness. For example, a 50-period simple moving average may be used to evaluate the pattern and only trade in trend direction.
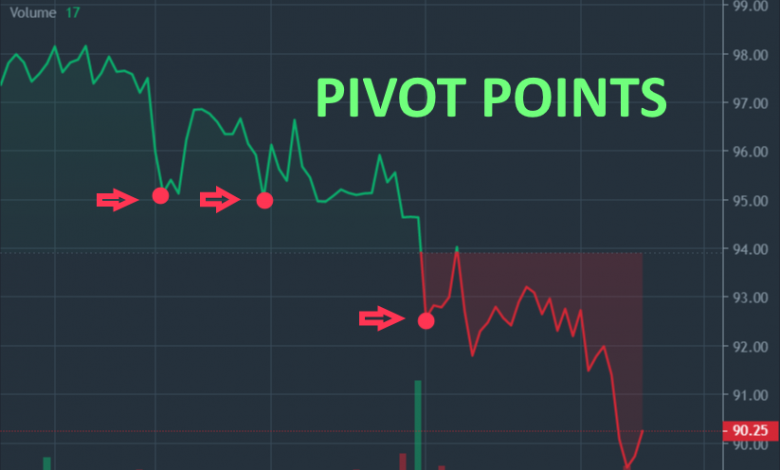
Furthermore, rather than taking the first contact of a pivot level, a second contact may be required to validate that the level is genuine as a turning point. Here’s an illustration of why it’s important to “check” the authenticity of a level before entering a trade on a simple touch. The EUR/USD is shown on a 5 minutes chart.

When fresh news or data is released, volume spikes dramatically, rendering prior period trading behavior and intraday support and resistance levels irrelevant. Price did actually hold between both pivot levels that are on the huge green bar. We could have traded both short and long in five minutes if we were trading each contact of the pivots.
After that, the market turned solidly negative and continued to fall slowly, displaying little sensitivity to pivot points.
As a result, you must exercise caution and ensure that you are not attempting to trade any levels that the market has no plan of honoring when there is high volume in the market.
PRINCIPLES
If we’re to lay down principles for this system, they would be as follows:
1. Depends on moving average
a) Only place long trades if the fifty-period simple moving average is favorably sloping.
c) Only place short trades if the fifty-period simple moving average is negatively sloping.
2. Trade only after confirming that the primary contact of the pivot level is considered as a rejection of the price level.
This will be used on a five-minute trading chart, but it can also be used on charts with greater (or lesser) time compressions.
The five-minute to hourly market chart is by far the most logical for day traders who employ daily pivot points. Swing traders should employ weekly pivot points mostly on 4-hour to daily charts when using this technique. Monthly pivot points on any of the daily and weekly charts are generally optimal for position traders.
However, this is a straightforward technique that can be successful.
Example
A five-minute market chart of the EUR/USD currency pair is shown below.

The market price is in a downward trend for the day, and upon recovery, the price rebounds off the Support 2 level (serving as resistance), resulting in a short trade on a secondary contact of Support 2.

This trade worked itself out well, after continuing the downtrend shortly thereafter.

EXITING THE TRADE
However, the next issue is: how do you know where to exit?
You must have an exit strategy in place before making a transaction. This can take a variety of forms.
The graphic below shows a number of choices.

Shortly after the trade starts going in our favor, a level of resistance emerges. Thus, it’s natural to expect opposition to emerge there once more in the future.
Furthermore, if the market price begins to consolidate and any trend momentum – or overall market volume – has gone, we may simply opt to quit the transaction.
We may also use a smidgeon of the moving average. Many traders utilize some of the most common moving averages of 50, 100, and/or 200 periods as resistance and support levels, or consider a gradual shift if the price rises just above the moving average under consideration.
In a pivot points system, a typical take-profit is, of a fact, at the next stage in the process. In this example, if we’re shorting at Support 2, our take-profit level may be Support 3. However, as previously said, reaching the most extreme levels, such as Support 3 and Resistance 3, is uncommon.
Day traders are entirely justified in taking transactions off the table as the trading day progresses and volume drops significantly.
A FEW THOUGHTS ON TIME ZONES
It’s also worth noting that pivot points are affected by time zones. The majority of pivot points are calculated using London or New York closing prices.
As a result, someone utilizing charting software with a closing time in Tokyo, San Francisco, or another time zone may have various pivot points drawn on their trade market chart that is not replicated on a big scale globally. This may possibly reduce or eliminate their utility.
So, it’s advised that you adjust your charting timings to either London or New York hours. Because both cities use daylight savings time, how they relate to UTC or GMT relies on where they are in the calendar.
Whatever time zone you select, keep in mind that pivot points may be backtested using historical price data.
It’s critical to make sure that the price in the market you’re trading is responsive to these levels.
IN CONCLUSION
Pivot points enable traders to have a glimpse of future market support and resistance levels. These can be particularly useful for traders as a leading indication for predicting market turns or consolidations. They may also be utilized as take-profit or stop-loss levels.
Although the most popular and ideal analytical technique for day traders are daily pivot points, certain charting tool enables you to draw pivot points for other periods too though (for example; weekly, monthly).
As with other indicators, you should not use them as the only basis for your trading decisions. Pivot point should be used with other types of technical indicators and/or analysis.