A ranging market refers to a trade market segment in which prices fluctuate from high to low. It is also popularly known as a choppy, sideways, range-bound, or flat market. If the prices are high, they form a resistance line that stops costs from going higher. Alternatively, the lower support line prevents prices from dipping further down. The variations of prices seen in a ranging market can be small or big. If a smaller range occurs, the exchange market is said to be in chop or moving sideways.
Range markets or rangebound is a state of the market that moves in a specific range of prices for a long period. Usually, traders don’t like those periods hence try to avoid trading while this situation persists. The reason for that matter is pretty simple – most trading strategies are aimed at a trend following and if there is no trend, there’s no trading. Simple as that.
The biggest damage falls on the beginner traders that have made their first profits during strong bull runs. Whenever the market starts ranging, their trading strategies lose their previous effectiveness, and they start losing money due to low experience in trading.
But does it mean that it’s impossible to make money while the market is ranging? Not really. Some traders tune up their strategies or trading systems to make a high profit with this exact type of market.
Let’s look at the ways that will help you to make money in the long-term ranging markets that sometimes become a real hell for beginners.
Contents
Using support and resistance points
Support and resistance points and often become a foundation of 50% of the trading strategies out there. Even though it’s quite simple even for a beginner it’s still an effective tool to determine entry and exit points on the market. Because support and resistance zones are formed only after price tests, using them in a range-bound market is one of the easiest solutions for traders.
First of all, let’s determine what is a range-bound market:
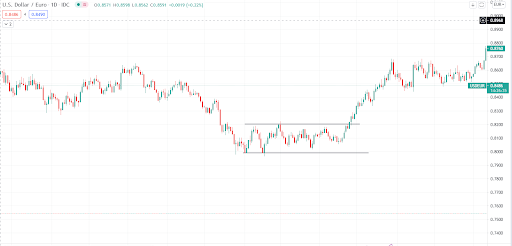
As you can see on the USD/EUR chart, the period on the chart that was ranging from an average of 0.82 and 0.79 Euro can be called a range. The range-bound market might not have precise values. The main indicator of a ranging market is a forward movement of the price and trend absence.
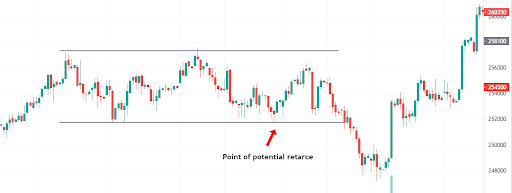
The first indicator of the range is the presence of the upper and lower borders that at the same time act as resistance and support zones. By determining those “borders”, you will be able to predict where price might retrace in one or another direction.
You can find a resistance point by connecting two points on the chart and drawing a line between them:
As you can see in the example, we have connected two points at the highs of the price movement and the lows. But why are those touching points not precise? The answer is simple: there is no need for them to be priced. We are trying to determine a range of the price and it won’t be necessary to look for point-to-point support or resistance zones.
How can we use those borders?
It’s quite simple: just buy when price hits the support border and sell when price hits the upper resistance border:
But the main drawback of such a strategy is the high chance of losing money when price breaks through one of the borders of the ranging market if stop-loss hasn’t been set correctly. So if you select this strategy, look for a range-bound with more than 2 tests of each border.
Trading on a range breakout
Trading on the breakouts of the nifty weekly range for example is the opposite of trading support and resistance borders of the trend. Instead of looking for a buy on the support, you are going to wait for the support (or resistance) to fall and do the opposite action. If the price breaks through the support of the range-bound, you will need to open a short position or sell, and if the price breaks through the upper border of the sideways moving trend, you will need to open a long position or buy.
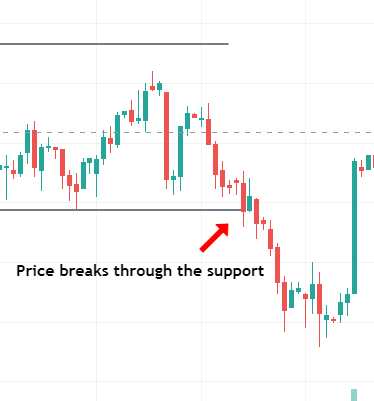
The main drawback of this trading method is the chance of getting stopped by a fake breakthrough. If you won’t set your stop-loss correctly you might lose a lot of money when the price goes back into the range.
False breakouts trading
If your strategy is based on fakeouts you are going to do the opposite of what breakout traders do. Instead of buying when the price goes through the resistance, you are going to sell. The only foundation that you will have is the candlestick pattern that will tell you about the nature of a breakout: if it’s true or fake.
Usually, fakeouts are followed by the pin bar candlestick pattern like here:
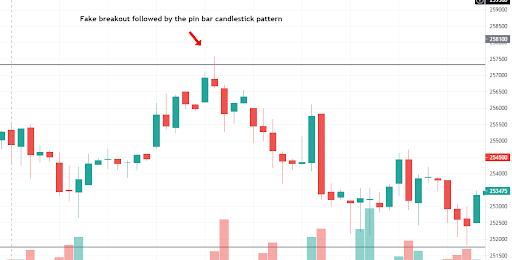
After the candle closes, you will be able to see if it’s a pattern or not. If the next candlestick opens in the range of the sideways moving market, it will be a confirmation of a fakeout for you. If the fakeout appears at the resistance level of the range-bound, traders will open a short position and wait until the trend reaches the support of the ranging market.
Look for traditional trading patterns like a triangle
Trading patterns are not the easiest thing to notice on a chart, especially for beginner traders. But sometimes it becomes a real savior for you. If you notice some kind of triangle within a sideways moving market you will be able to easily identify when it can potentially end or where to enter or exit the position.
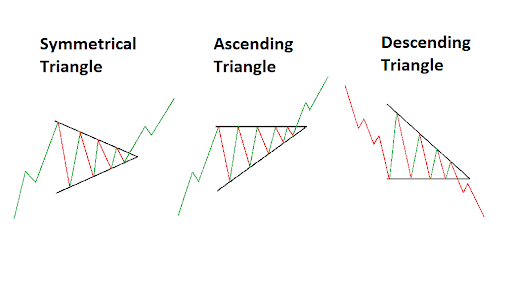
Symmetrical, ascending, or descending triangles are pretty similar to each other’s patterns that have one thing in common: descending volatility. What does it mean? Descending volatility is the progressive decrease of the range that price moves. On a chart, it will look like a narrowing of the price movement. If you are able to find and draw upper and lower lines for that movement you will see the triangle pattern.
If the lower line of the triangle looks up while the upper line looks down you are facing a symmetrical triangle that doesn’t show you the future movements of the price. If the upper line of the triangle looks down while the lower line is straight you are facing a descending triangle pattern, that might be a short-term downtrend movement.
If the situation is visa-versa and the lower line is looking up while the upper line is straight, you are facing an ascending triangle. Usually, it appears in a short-term uptrend movement which leads to the end of the range-bound market and the start of the long-term uptrend.
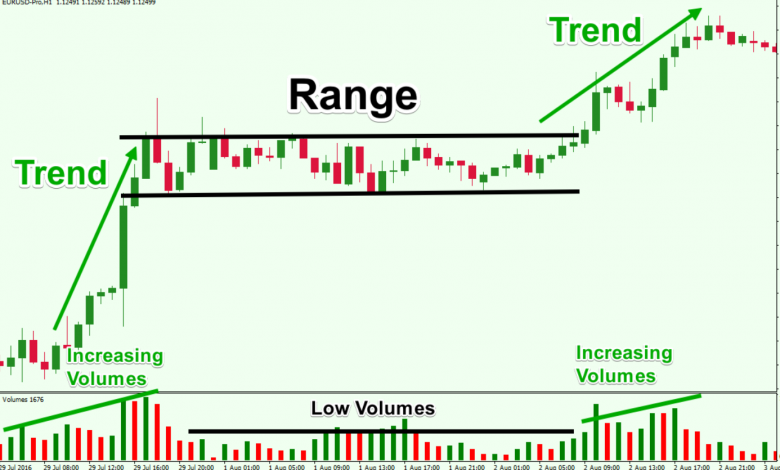
Using volume to determine the potential end of the range market
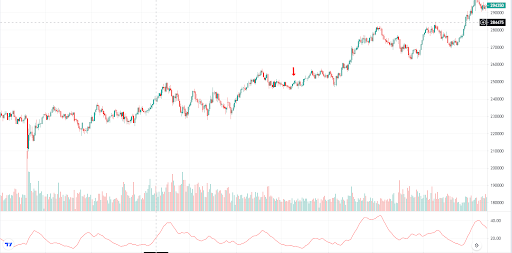
Volume is a simple yet effective tool in the hands of an experienced stock market trader. Even though volume only shows you the number of trades that are taking place on the market, you can easily use it to determine whether traders support range breakout or not.
During different types of markets (trending or ranging), volumes can show you different profiles and patterns that might help you to determine whether there’s a change in trend or a continuation.
But unfortunately, volume is not the best indicator to predict the market condition or nifty range tomorrow. Even though it can help to confirm a theory that you’ve received by using a different indicator than specific data. Relying on volume only might end up in a loss since sometimes it does not rely on the price action only.
Using Bollinger bands to trade in a ranging market
Bollinger Bands (BBs) work in a similar way as the general support and resistance points or borders. Bollinger band is the indicator that shows you a couple of things at the same time:
- Support and resistance points that are based on market overbought and oversold levels.
- General market volatility.
- Trend direction on the chart.
In our first case, we don’t need the last two functions of this indicator. We are only interested in the support and resistance points that Bollinger provides us with.
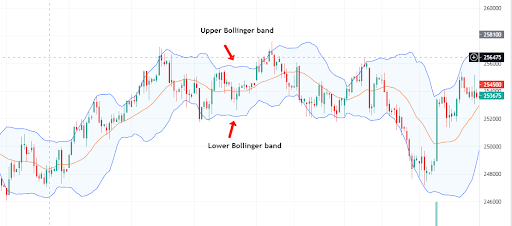
For example, in forex range market trading, we can use Bollinger bands to find the best point to buy or sell a currency that we hold. As you might have guessed, the upper Bollinger band acts as resistance and the lower Bollinger band acts as support. Whenever price hits the lower band, it is most likely to bounce back up and do the opposite if it hits the upper Bollinger band.
But it’s not always the best idea to use Bollinger bands to trade in the range market. Since Bollinger bands are also a trend indicator you would most likely use it to determine if there’s a point to trade in that market at all. Usually, BBs are being used to avoid trading in ranging markets. Once the price starts to move sideways, bands are narrowing closer to each other and showing us that the current volatility on the market is lower than usual.
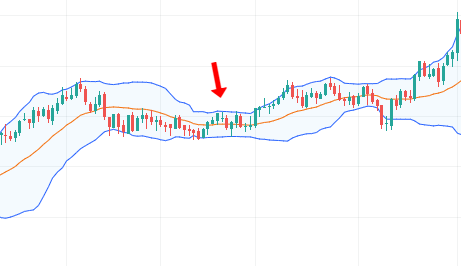
As you can see, in the periods of ranging market bands are closer to each other and after the range breaks, the bands start furthering from each other showing us that the market becomes volatile again and moves in the direction of some trend.
You might’ve also noticed the line between the two bands. It’s the moving average line with the period of 20 which on the daily chart will equal 20 days. That line shows us the overall trend on the position and sometimes acts as a support or resistance.
In a trending market, that line becomes an indicator of a trend reversal. If the price stays above it and moves up and then falls under it we can consider it as a first signal for exiting the position.
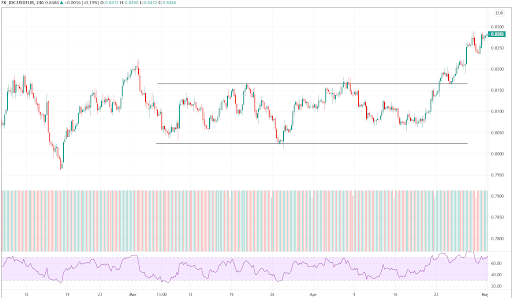
Using ADX to determine ranging market
ADX is another indicator that will help you to avoid the range-bound market that often leads to losses for a lot of traders. The average directional index will most likely show you a reduced value while the market is ranging or just moving sideways.
If ADX shows you a value less than 25, the market is ranging and you should avoid using trend-following trading strategies.
Alternative solution: change your trading pair
Trading in a ranging market might be frustrating, so instead of spending time trying to find an effective trading strategy for predicting daily prices, it would be easier to keep your current approach and just change the trading pair.
Above, you’ve seen the indicators that will help you to figure out if the market is ranging or moving inside of a trend. Use those tools and change your trading pair to one that’s more suitable for you. But be careful: there’s no point in choosing trading pairs tied to each other.
For example, USD/EUR and USD/JPY forex pairs usually show the same tendencies and trends. If one of them is in a range-bound market, you should consider finding a completely different pair on another market.
Conclusion
Ranging markets are difficult to work with even for experienced traders. Most of them use additional indicators inside of their trading systems to avoid range-bound markets and to not lose money in them. Even though there are ways to trade in ranging markets, there is inherently no point in making risky trades in an unstable market that can break out at any moment.
But if you are really looking to try and trade in the range-bound forex or stocks market, one of the best solutions would be just to use common support and resistance zones. There’s no need to implement dozens of indicators that you don’t actually need in the sideways moving market.
But the most important rule that you should always follow is not to use a trading strategy that you usually apply in a trending market. Strategies that aim for trend following are dommed in a range-bound market. That’s why traders just stop trading on the pairs that start ranging and do not follow one exact trend.
Another way of playing it out is just changing trading pairs that you are tracking and trading on. By choosing another trading pair, you will have the ability to look for a chart that is more pleasing for you and your trading strategy.