What is the ABCD pattern? Find out how to reveal AB=CD on trading charts, the ways it forms and trade strategies with this indicator.
Contents
Traders who use scalping strategies often use patterns to reveal intraday or mid-term market trends. Let’s find out how the ABCD pattern can help you understand the market and trade more efficiently by making more precise asset price predictions.
What is the ABCD pattern?
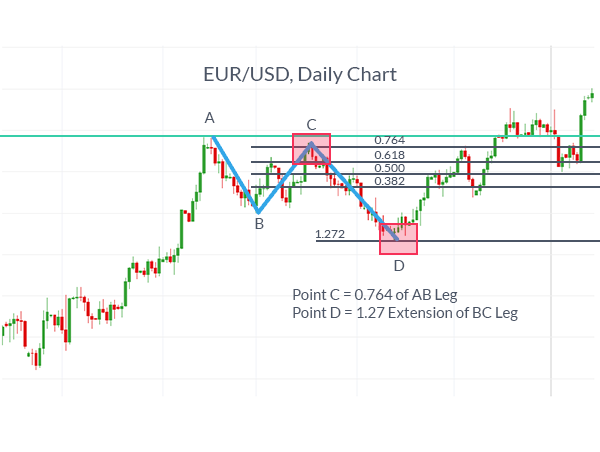
The AB = CD pattern is a price structure where price movements are equivalent. The Fibonacci numbers in the pattern should appear at certain points. In the ideal ABCD pattern, point C should represent retracement 0.618 or 0.786. This pullback justifies the B-C projection, which should complete at 1.27 or 1.618. It is important to note that the 0.618 retracement at point C results in the B-C projection 1.618. A retracement 0.786 at point C means projection B-C 1.27. It is important to remember that the B-C projection should roughly match the AB = CD movements.
How it forms
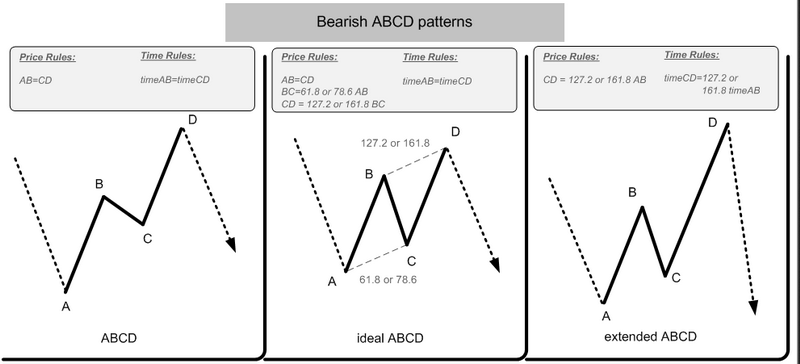
- The pattern starts to form from wave AB.
- BC is, as a rule, a sharp correction (pullback), which is formed at Fibonacci levels from 0.382 to 0.886 from AB. Ideally – at the 0.618 level
- At point C, the price reverses and moves parallel to the segment AB. In this case, point D should be in the range from 1.13 to 2.618 from BC
The main rule of the symmetric ABCD pattern is that the segments AB and CD should be approximately equal (not high and low relative to each other), both in terms of price levels and in terms of formation time. But, in practice, it often happens that the segments have different lengths – this is also acceptable, but it will be more difficult to perform trading with such figures.
How does this pattern work?
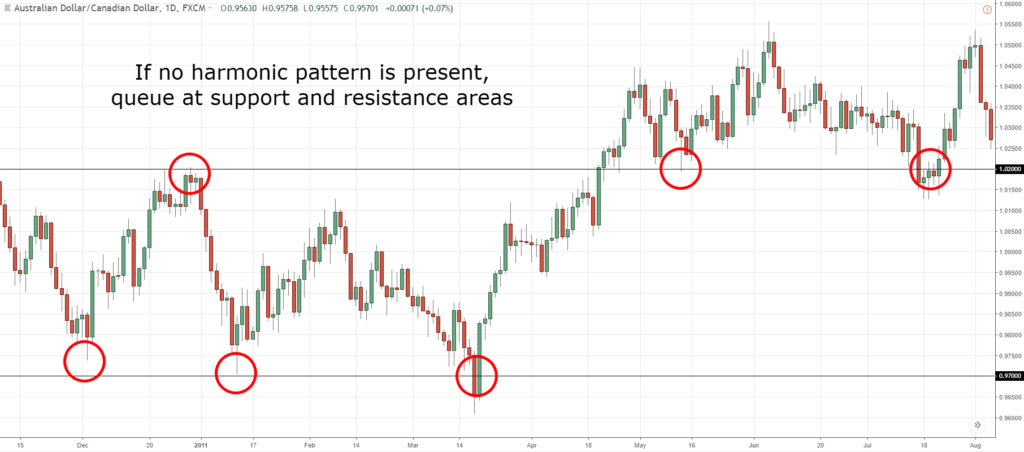
Although the basic AB = CD structure can have many Fibonacci relationships, the concept of support or resistance at the completion of two distinct and contiguous price segments is the essence of all harmonic patterns.
Alternating AB = CD patterns emphasize the importance of using a basic structure to determine the completion of certain patterns. In any ABCD, the design of the BC must complement the sample completion point. It is important to remember that a C relationship indicates a BC design. Perfect AB = CD uses 0.618 retracement and 1.618 extension as the most harmonic match of Fibonacci ratios for the pattern.
Rules & laws of ABCD
Many traders would agree that this pattern must have certain characteristics in order to be a valid harmonic structure and to determine a trading opportunity:
1. In each trade case, you should define the minimum price level of completion for ABCD.
2. Recovery in C can range from 0.382 to 0.886, although 0.618 is high enough.
3. The draft BC may change from 1.13 to 3.618 and is subject to the reinstatement of point C.
4. There is an alternation of AB = CD models.
How to draw this pattern?
The method for finding this pattern is quite simple. Clearly, the AB line must be equal to the CD line, but it is important to take into account the “Fibonacci Levels”. That means traders should find a line going in one of the directions, then pull the Fibonacci grid at the beginning of the correction and wait for the 0.618 level. After that, pull the “Fibonacci Expansion” and wait for the high level of 1.272, and as soon as the price bounces off this level, you can prepare for a bearish market.
How to trade with ABCD?
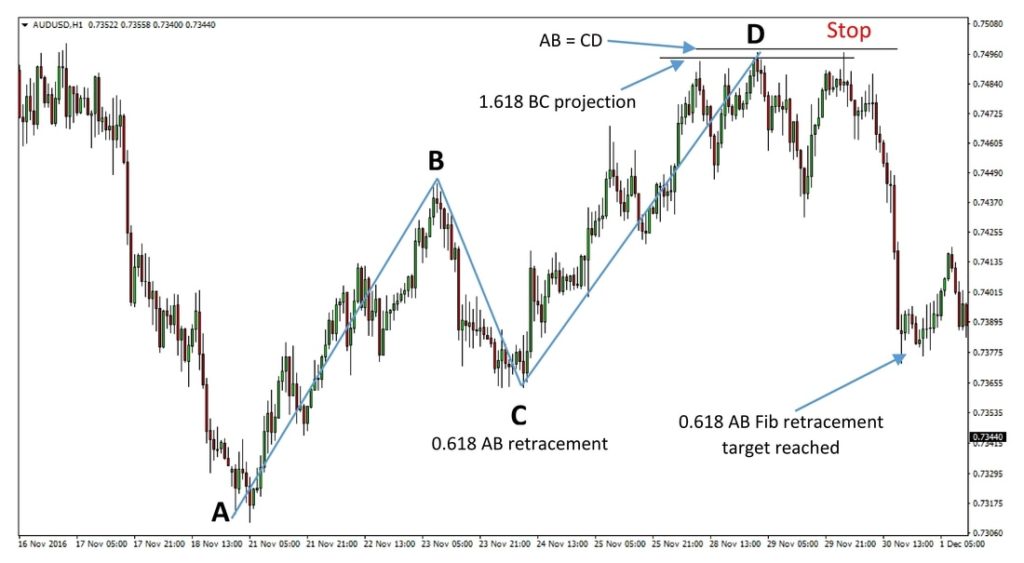
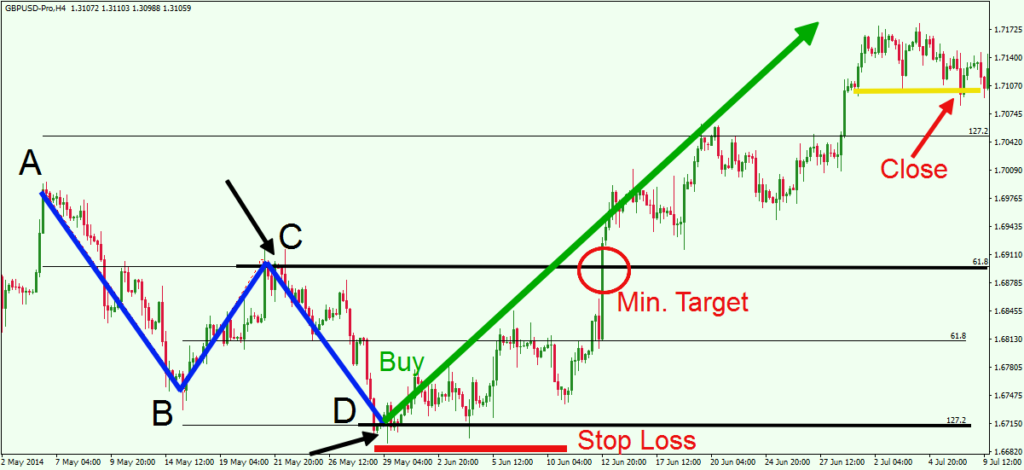
In this pattern, the AB and CD lines are the legs, while the BC is the correction or retracement (Fibonacci). The market retracement level BC is measured at 0.618, and the CD line is measured at 1.272.
How to trade stocks with a harmonious ABCD pattern correctly?
- Visually define three points ABC: segment AB (trend impulse) and rollback BC
- Measure the size of the correction. The BC rollback should form at levels from 0.382 to 0.886 levels.
- Determine point D: stretch the Fibonacci grid from point B to point C so that the level at point B corresponds to the BC correction.
- Determine the targets of price movement from point D. Extend the Fibonacci levels from point A to point D. The minimum expected target will be at the level of 0.382 or 0.618. Maximum goals at point A and point C levels.
- If possible, place a pending deal at point D to the side, against the movement of CD.
- Stop loss is set behind level D.
Do not open a trade until two conditions are met:
- Length AB must match the length CD.
The time it took for the price to go from point A to B should be similar to the formation time for the line from C to D.
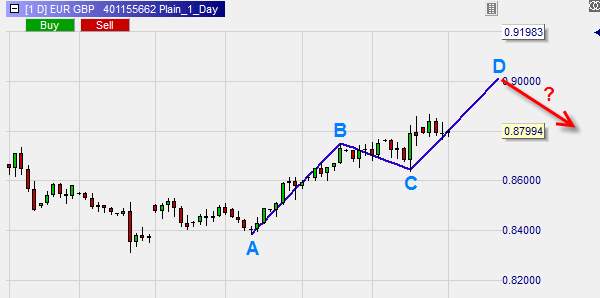
We sell or buy immediately after a rebound from the level of 1.272, place a stop immediately below the next high or low, and close the trade in profit when the point C is reached. ABCD is usually a reversal pattern.
Bottom Line
It’s important to mention that many Fibonacci-related analysts have simplified this pattern in recent years. The idea of trading stocks with every ABCD that ends on the market is absurd. It requires many other considerations to validate and complement the strategy by the end of the pattern. Preferably, the structure should possess other Fibonacci restorations or projections. However, the most important concept is that AB = CD is the basic structure of all harmonic patterns.
FAQ
This is a trading pattern that forms when price movements are equivalent. It is typically used to predict price reversals.
To automate market analysis with this tool, you can try a ZUP indicator, but it aligns other tools, such as Gartley and Pesavento patterns. To see our pattern only, use the PZ ABCD Retracement indicator. It’s available on some exchanges. After being installed on the trading terminal, it searches for all formations similar to the pattern of the same name and marks them on the stock dashboard.
It is quite easy to implement this pattern into your trading system. When traders find this pattern, they look at a set of standard indicators for the presence of price divergences or convergences. Traders often use MACD, RSI, Stoch, CCI and other oscillators.