ROC (Rate of Change) indicator is a helpful tool for long-term traders as it gives a deeper insight into price fluctuations. Let’s find out how to interpret RoC and apply it in trading strategies.
ROC indicator definition
RoC, or Rate of Change, is an indicator that’s used in trading terminals to analyze charts and make forecasts for trading. It is made in the form of a classic oscillator, which graphically demonstrates the market situation and the movements of the curve of which are used to judge the upcoming changes in the price of a currency pair.
To use the indicator, you do not need specific skills and knowledge – it is enough to carry out a simple installation and adjustment, and then – to navigate according to the given signals.
Rate of Change indicator for market analysis The RoC setting is to set a digital value (by default – 9), upon reaching which the instrument will give a signal on the chart. Traders take into account that with a high value of this parameter, signals are received less often, but their forecasts are correct. When the value is low, frequent signals are inaccurate, those can be predictions of short-term price reversals.
Accordingly, a signal with a high value is suitable for traders with long-term strategies, while short RoC signals will help those who specialize in short-term trades.
How to calculate ROC?
It should be noted that initially the Rate of Change was calculated as a quotient of dividing the current price by the price of n periods ago (by default, Rate of Change takes the closing price 5 periods ago), which was not always convenient, since the result of RoC reading was in the form of a price dimension.
Today, the Rate of Change is calculated as a percentage difference between the current price and the price of the specified period of the past. It is worth noting that the calculation, even with the old approach to RoC, is very simple and does not use averaging.
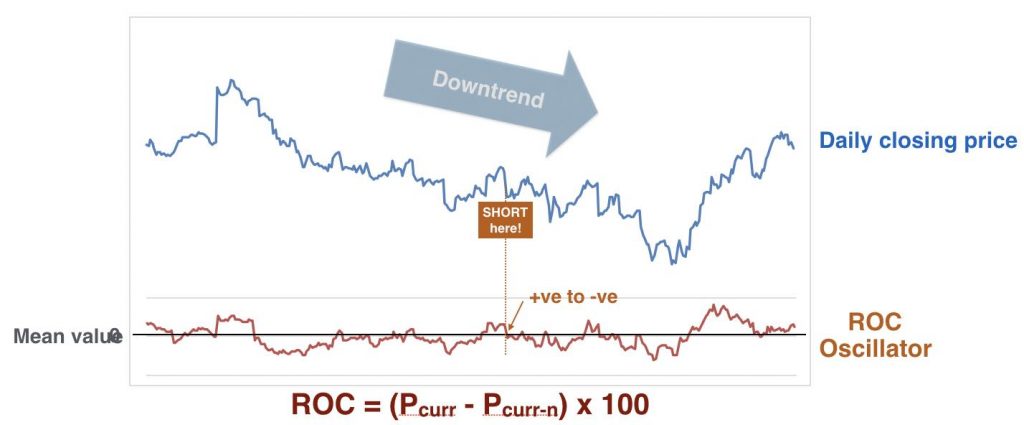
Rate of Change is calculated using the formula:
ROC = (Pt / Pt-n) x 100%
Pt – current position price;
Pt-n – the price of a similar position some time ago.
The result of calculations using this formula will be the growth rate of the asset price for the specified period. Most often, N is the time frame for analyzing the situation. With RoC, traders typically take a period of 12 or 15 days. Such indicators are convenient for medium and long-term trading.
Why is ROC used for trading?
The Rate of Change indicator is an oscillator that shows the difference between the current price and the price of a certain period in the past, expressed as a percentage.
Moreover, depending on the calculation period of the Rate of Change indicator, it can be either an oscillator (with a period of 5-14) or a trend indicator (with a period of more than 20).
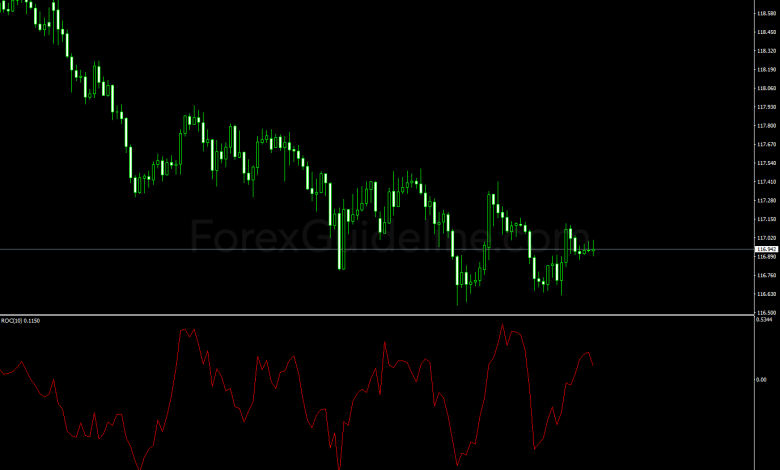
RoC does not have an averaging model in the base of its calculation, therefore it is synchronous with the price, and in some cases even leading, but not lagging in any way. Rate of Change is usually displayed in the price chart window of the analyzed asset from below in a new area, and is a broken line that changes relative to the zero line both in the positive direction (when the price rises relative to the compared price of the past) and in the negative direction (when the price falls relative to the compared prices of the past).
How to read ROC?
ROC tool is simple and accurate enough that it can be easily used by both beginners with zero experience for the simplest operations and traders with above average knowledge to draw up their own trading strategies. The indicator of the speed of price transformations gives signals. Based on the indications of RoC, fluctuations of the market are predicted.
When studying the schedule of ROC, a trader can notice that the following signals are possible:
- Crossing the border and moving the line down is a sign of an intensification of the downtrend.
- Growth after falling to the lower bounds indicates that the decline in the asset price is subsiding.
- With a sharp reversal of the chart from a downward movement to an upward movement, a signal is given that the trend changes from a decline to growth of prices.
- If Rate Of Change gives a signal about crossing the set line, the upward trend intensifies.
- A sharp downward reversal from the top point of the RoC chart is a forecast of a fall in the price of an asset.
- The downward movement of the RoC chart is a gradual decline in the asset price.
When using the RoC chart, the trader can compare the forecasts with changes in the trades. Discrepancies with forecasts with the correct setting of the price rate of change indicator are close to zero.
How to trade with ROC?
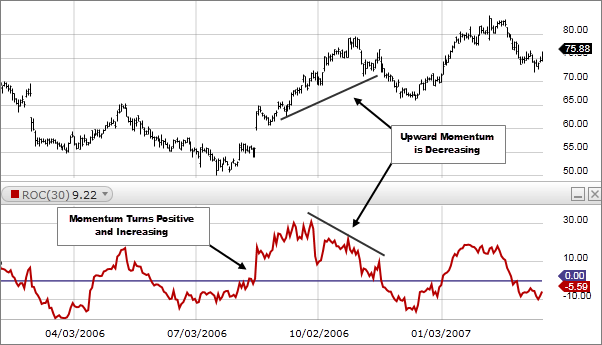
At its core, the indicator compares the price, i.e. says what happens to prices, whether they rise or fall. But more importantly, the Rate of Change is able to characterize this change, since if on the indicator chart we see the highs update while the lows are not renewed, this indicates that the uptrend is in force, and we should expect the formation of even higher highs. But the ability to characterize trends Rate of Change gets when using a period of more than 20, since usually this number of candles is enough to form an extremum, and it turns out that the indicator becomes able to compare them with each other.
- If the Rate of Change is above zero, the positive trend is strong and it is more expedient to buy.
- If the Rate of Change is below zero, the bears are stronger and sales will be more profitable.
If we see an update of the lows on the indicator chart in the absence of new highs, then this indicates a downtrend and that the appearance of another, deeper low is more likely.
By introducing the price difference into the calculation of the indicator, you can define whether the current trend is capable of accelerating, or, on the contrary, has already begun to slow down and it is no longer worth entering into it. Also, the indicator is able to break through its trend lines several periods earlier than the price, which makes it somewhat ahead.
Examples of ROC trading strategies
Trading signals coming from Rate of Change are of the following types:
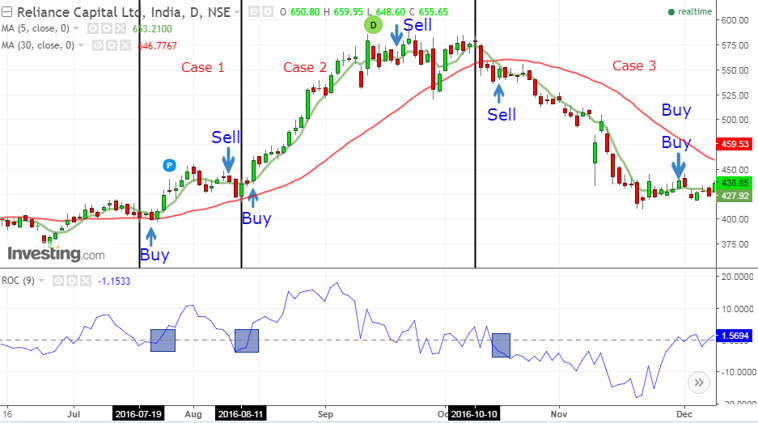
- Breakout of the zero level for the “short” Rate of Change (period 5-14), showing the interception of initiative between bulls and bears;
- Breakdown of the trend line – a signal for a “long” Rate of Change (period over 20), showing that the current trend at the stock price is already exhausted and ready for a reversal;
- Divergence with the price (also for the “long” Rate of Change), showing that prices move along the trend, and its change is more likely than its continuation.
‘Short’ strategy
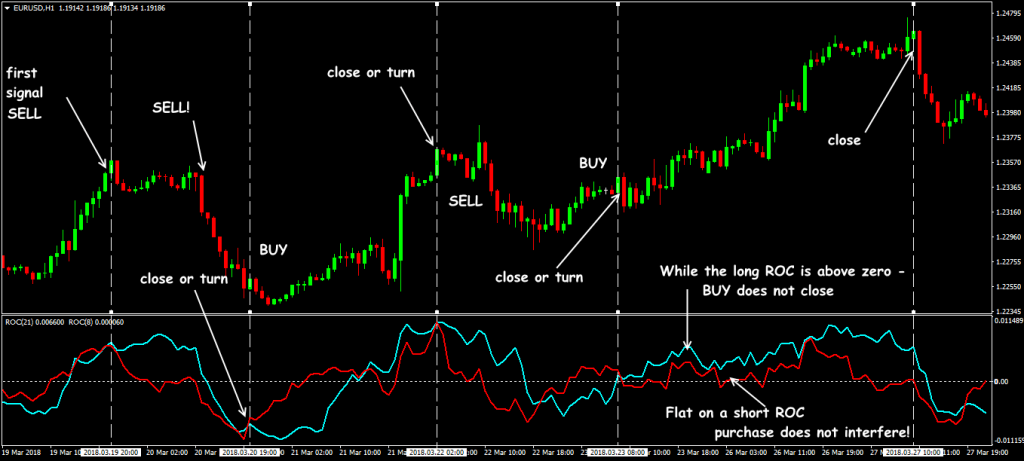
If the “fast” Rate of Change crosses its zero line from the bottom up, you should buy at the opening of the next candle, if the Rate of Change is at that time above zero. If the Rate of Change crosses the zero line from top to bottom, it is more profitable to sell at the opening of the next candle, if the indicator is below zero at this time. In both cases, the stop should be placed behind the last extreme.
‘Long’ strategy
If the “slow” Rate of Change begins to break through its trend line (even if the indicator does not cross the zero zone at this time), at the opening of the next candle, you should make a deal in the direction of the indicator breakdown, placing a protective stop behind the last local extreme. Also, during periods of a trend at a long Rate of Change, you can make deals at a fast RoC, when it crosses its zero level, at the opening of the next candle, if the sign of the indicator value at this time is still changed. The stop is placed behind the last extreme.
ROC and other tools for market analysis
The RoC indicator, as described by traders, lacks the accuracy to be used as a primary technical tool. Because of this, when trading on the market, it is worth using several similar tools and reacting to signals only after multiple confirmations of changes.
As a rule, ROC is used together with:
- ADX (Average Directional Movement Index)
- Alligator
- AMA (Adaptive Moving Average)
- Ichimoku
- Moving Average (MA)
- Fractals
And one more tool is also applied with RoC.
Momentum indicator
One of the indicators reflecting price movements and the market trend is oscillator Momentum:
Momentum = p (t) / p (t – n)
p (t) – the current price valuep
(t – n) – quote n periods ago.
The averaging window (n) can be expressed both in minutes and in months, depending on the forecasting conditions. The Momentum formula is sometimes written as price differences spaced over time by a preset amount. This makes the momentum indicator a simple and reasonably effective tool during price rallies.
How to interpret the Momentum indicator:
- If the indicator is at an extreme point and starts moving in the opposite direction to the dominant one, a trader should prepare for the release of momentum and positive turns.
- A breakdown of a preselected level indicates zero dynamics.
- The intersection of RoC with the moving average of the indicator suggests a correction of the global trend.
- Divergence with the price chart might also be a positive sign of a trend reversal when the momentum of an asset is gained.
Also, when it comes to Momentum, divergences may appear on the “long” Rate of Change, when the price forms a new extremum along with the trend in the trend body, and Rate of Change already stops updating the extremum and draws it flatter, which indicates a possible trend reversal. The momentum tool complements RoC in trading when speed is not of priority.
Conclusion
RoC is often used not only as an advisor for transactions but also for capturing general changes in the foreign exchange market. Rate of Change is a great versatile tool for long-term trading strategies, no matter which stocks and assets are handled. It is a great addition to Momentum and other tools.
Key Takeaways
- The rate of Change indicator shows price moves over a certain period and allows traders to make forecasts.
- It is used in combination with other indicators to get a broader picture.
- RoC shows possible trend changes with a high level of precision.