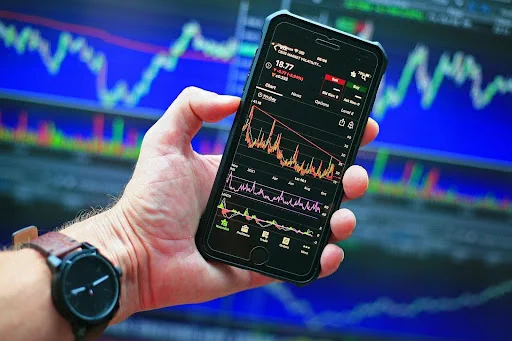
Looking for a simple but reliable price strategy? Price action trading is what you need. It’s a straightforward strategy that tells you what you need to know rather than leaving you to speculate what might happen. Unlike indicators and algorithms, price action relies on the history of market prices. It helps you spot dead, end, and red zones by assessing historical prices. The relationship between historical and ongoing prices is solid, making it a holy grail for day traders since they use price information in real-time.
Definition Price Action Strategy
This is a strategy of making trading decisions using past prices. Traders, therefore, decide on when to trade based on fluctuation of prices in the past and not indicators and fundamental factors. It simply shows how prices in the past reacted to resistance or support and helps in the identification of high or low swings, resistance areas, and past support.
What is Support and Resistance
Support – refers to a horizontal area on the trading chart where high demand from buyers push the prices upwards.
Resistance – this is an area (horizontal) on the chart where it’s expected that excess supply will lower the prices of securities.
When the price breaks support, it becomes resistance meaning that traders who were long when the price breaks support will suffer losses. When the price rallies back, however, the traders can break even, which induces selling pressure.
Facts About Price Action
Before we proceed, here are some key things to keep in mind;
- As a price action trader, you analyze what’s in front of you, such as trends and patterns. Therefore, price action trading discounts everything and, as a result, receives a lot of criticism.
- Prices move according to trends established, so all future prices are likely to stay in a similar direction.
- Finally, history always repeats itself since traders repeat the same habits. Remember you are using trading charts designed long ago and remain relevant to date. When reading the price action chart, you look at a trader’s behavior revealing itself through patterns.
How To Read Price Action
Price action trading entails reading and analyzing impulse and corrective waves. It’s crucial to understand that a trend is formed when trending waves are bigger than pullback waves. The price makes higher swing highs and lows in an uptrend, and the reverse is true in a downtrend. Therefore, the toughs and booms of the waves float between support and resistance lines on the price chart.
These waves can also form ranges when they are equal in size for both trough and peak, triangles when the price gradually decreases and expanding ranges when there are higher swing highs and lower swing lows.
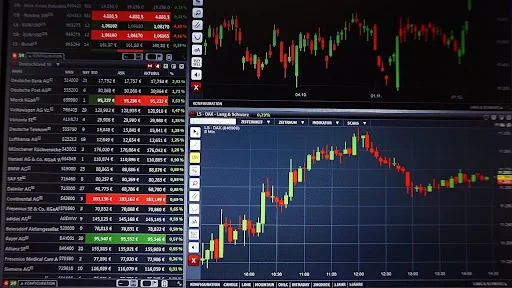
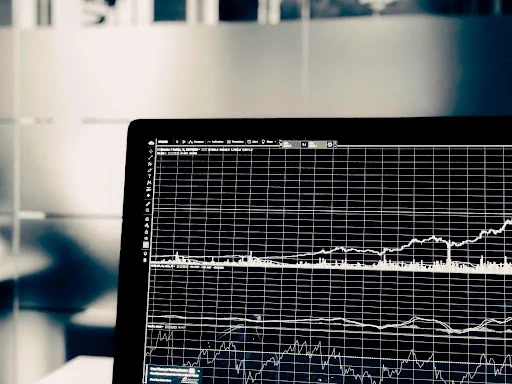
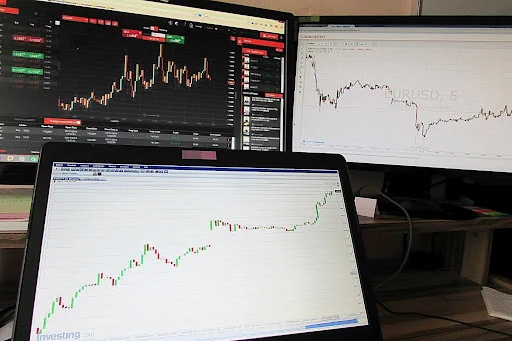
Clean Charts vs. Messy Indicator Charts
The room on the chart creates a significant difference between price action and indicator charts. The former is relatively clean, while the latter is very messy. In indicator charts, you will notice the lack of room due to numerous indicators at the bottom. Since there is barely any room, these charts are smaller. All the attention is emphasized on the indicators rather than the price action. On the other hand, price action trading charts are easier to read and analyze since there is sufficient room on the graph, and all attention is on the market prices.
Price Action vs. Indicators vs. Technical Analysis
Price action trading is based on the potential of a price pattern to repeat itself. Traders simply use their gut and power of observation to make decisions on when and what to trade. There is no complicated analysis involved.
Indicators, on the other hand, are flickers of information showing average prices in the market as well as oversold and overbought securities. Expert traders can quickly spot these signals and quickly trade in real-time or as it is being displayed on the chart. It means that they are using old price information to create market indicators.
Technical analysis uses calculations to predict future market prices. In a way, it tries to find a balance or order in the somewhat chaotic trading world.
How to Trade Supply and Demand with Price Action
A demand area is seen where there is an influx of buyers in the market, pushing prices up, and it’s yet to return to the equilibrium price. A supply area arises where traders have flooded the market, pushing the price down. In both cases, the market participants are watching keenly for the prices to return to equilibrium so they can take advantage before it changes again.
Price Action Trading Strategies
Trend Trading
Price action trading has been defined as the study of price movements, while trend trading studies trends in market price movements. Trend trading can help traders use several trading techniques to spot and follow trends. Beginners can learn a thing or two by following trading trends of veteran traders using price action charts.
Inside Bar
This is a two-year strategy where the outer bar is bigger than the inner bar, which forms during consolidation. The trends are super easy to spot and use especially for experienced traders.
Pin Bar
The strategy closely resembles the candlestick pattern due to the shape of the pins. It represents a reversal of a particular market price, and traders can assume that the price keeps moving opposite of the candle’s tail.
Head and Shoulders Reversal Trade
This is a market movement that looks like a silhouette of a head and shoulders. The price rises and falls severally before a decent drop. The strategy is super easy to understand when selecting an entry point, making it super popular.
Benefits of Price Action Trading Strategies
The strategy is ideal for swing and day traders for a couple of reasons. First, it entails minimal use of technical analysis, meaning they are simple to read and interpret. Secondly, they can also be applied in all markets, from forex to stocks. Finally, these market strategies are clear and actionable because once a trader identifies dead and red zones, the lines on the chart will be clearly drawn.
Key Takeaways
- Price action focuses on the real market price and not moving averages and complicated theory.
- It’s popular among FX traders because of the liquidity and size of the market.
- There are a variety of strategies traders can use to predict movement in market prices.
- Price action is super easy to read and interpret even for beginners since the charts are super clean and information is based on past prices.