How Open High Low Strategy Works in 2022 Trading
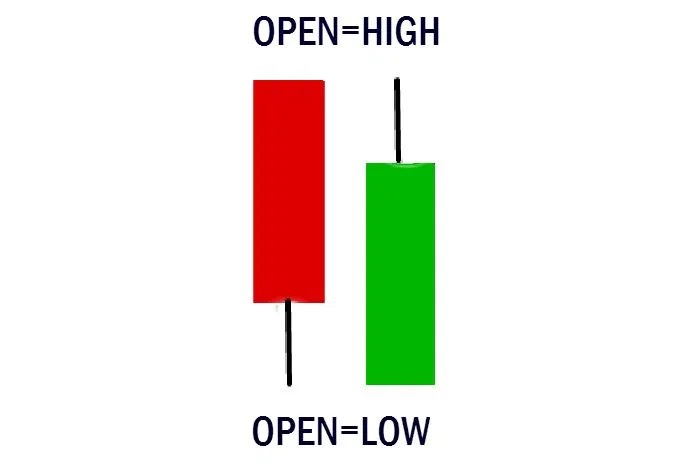
Table of contents
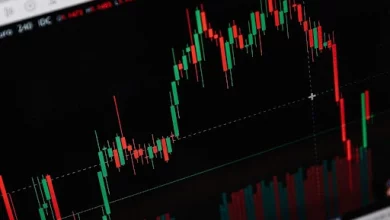
Stock price movements are reflected in candlesticks, namely Open, High and Low. Before we continue about technical analysis, we must first understand more about stock price analysis. Stock price analysis is very useful to see the trend of stock trends, both for the short, medium and even long term. In this article, we will try to explain one simple way to analyze stock prices using Open, High and Low strategy.
In other words, this technical analysis can be used to see the support and resistance points of a stock. Especially if you connect the low and high points on the candle in one line, a support-resistance line will be formed. Before we learn further, here are the details of Open, High and Low price you have to understand. By understanding the details, we will be able to read the candlesticks chart and understand the price movement.
Open
What is Open? Open is the open price or the opening price is the price for the first time a transaction is made on that day. The open price reflects all available market open information, which occurs or appears between the closing price of the previous day and the last moment investors may enter orders into the stock exchange engine. Everything that happened between the close of the last trade, until the last moment people were allowed to place orders into the stock exchange machine the morning before the opening, that is what will shape the open price.
High and Low
The high (highest) price and the low (lowest) price are the price range of the daily movement of the stock where the investor has the courage or rationality to make a buy position or a sell position. If there is information that says that the stock price can soar as high as it can be, investors can continue to buy so that the price is closed at the top auto rejection position, and vice versa. If there is no news and the stock loses interest from investors to trade the stock, it is possible that the high and low prices will occur at the same price (the price does not move).
In one of the trading strategies, you will see how the candlesticks chart sends you a signal to be understood. The first signal should be the buy signal. It signal happens when the stock has the same value for open and low. The next signal is the sell signal when the stock has the same value for open and high. From the previous description, we can summarize it as a formula which is Open Low means buy and Open High means sell.
Benefits of Open High Low Strategy
There are some benefits of using this strategy. The first is that the open high low strategy success rate is high and it is quite easy to be used by both novice traders and experienced day traders. It can benefit from this trading strategy, especially for intraday trading. Secondly, this strategy doesn’t require prolonged analysis. It means that you don’t have to spend countless hours analyzing the market or your excel. You just need a few minutes each day by visiting websites with charts or mobile apps to determine the right indicator of whether they’re going to have a bullish day or a bearish day. That’s why it is very suitable for intraday trading.
How To Use Open High Low Strategy on Your Trading
You can find the chance to use this open high low close strategy on your trading in three different ranges. The first with the highest chance is in the time after a sideways price action. The second one is at the start of a trading session and the last one is from a strong supply or demand zone. Following the chance, there are some rules you have to follow. The first is to let your charts get 15 min candlestick, from 9.15 to 9.30 am. Then find the stocks that have open=High and Open=Low. After that at 9.31–9.45 shortlist the stocks that opened above the previous candle in the Open=Low category and the stock opened below the previous candle in the Open=High category then punch the orders based on the market and sector trend. Read carefully the open equal to high low strategy.
Additional rules you have to remember for Open=Low is to make sure your stop loss should be the low of the first 15-minute candle. Get out of stock instantly if your stop loss breaks the low. On the other hand, for Open=High, get out of the stock if your stop loss breaks the high. The stop loss should be the high of the first candle. And if the order goes against you, don’t do average, but keep trailing stop-loss. If it breaches the trailing stop-loss, book profits instantly.
Useful Tip
For another tip, to support your open high low scanner use a weekly chart to analyze a longer-term trends, although you are doing intraday trading. It is important to use analyze the long-term trend because trading in the direction of the trend will help you increase the open high low strategy accuracy and also the profit. For example, if stocks open with Open Low and the weekly chart is also in the upper trend, you can set for Long with confidence. But on the other hand, if it is Open High plus the weekly chart is a downtrend, you can short your confidence and try different formula to be done.
Choosing high liquids stocks is suggested in intraday trading. It will help you to Enter and Exit the trade not only easily and quickly but also less risky. That’s why this open day’s high low strategy is chosen to elevate the time of trading. Take a note that there is no foolproof strategy, but if you choose to follow the stop loss, you can minimize the loss and book decent money profits.
Good luck with your trading strategies!

